-01%201.svg)

Key takeaways
- A management reporting package gives Indian startup founders a single, investor-ready document that replaces last-minute scrambles with a consistent monthly rhythm covering P&L, cash, compliance, and action items.
- Anchor every board deck on a clean monthly close with automated reconciliations, mapping each metric to a definition, an owner, and a next step so nothing drifts between meetings.
- Focus on metrics that signal growth quality and cash discipline, especially India-first indicators like GST input credit positions, TDS hygiene, DSO under 45 days, and working capital cycles under 60 days.
- Automating data ingestion, ledger sync, and anomaly detection can cut close time from 10 days to 3, freeing your finance team to analyse and narrate instead of wrangle data.
- Start simple. Ship a working system in 7 days, then scale with consolidation, predictive cash flow, and audit-ready trails as your startup grows past Series A.
- Platforms like AI Accountant's MIS reporting engine handle the repetitive extraction, categorisation, and dashboard refresh work so CAs and founders focus on decisions, not data entry.
Management reporting for Indian startups: what's new in 2026
The reporting environment for Indian startups has shifted in concrete ways since 2025. Here is what matters for your next board pack.
Until March 2025, GST e-invoicing applied to businesses with turnover above ₹5 crore. From April 2025, that threshold dropped to ₹1 crore, pulling a significantly larger pool of SMEs and early-stage startups into the e-invoicing net. If your startup crossed this line, your monthly close now includes validating IRN generation for every B2B invoice before filing GSTR-1. Missing or mismatched IRNs can block ITC claims for your buyers and trigger compliance flags during assessments, per GST portal notifications.
Funding slowdowns have also changed what investors scrutinise. With Indian startup funding at roughly $2.1 billion in Q1 2026 (down from peak levels), boards are spending more time on burn multiple, cash conversion cycle, and collections velocity than top-line ARR. If your management reporting package does not break out DSO by customer segment and tie it to runway scenarios, expect pointed questions.
On the operational side, CBIC's push for real-time return validation means reconciliation gaps between GSTR-2B and your purchase register surface faster. Startups that rely on quarterly or ad hoc GST reconciliation are finding mismatches flagged before they can fix them, leading to notices and blocked credits. The practical fix is embedding automated 2B matching into your monthly close checklist, not treating it as a quarterly cleanup.
For finance teams on Tally, the shift toward API-first data flows means manual CSV exports are becoming a bottleneck. Firms that have moved to automated bookkeeping workflows report close times consistently under 4 days, even with multi-entity structures. If you are still copying numbers between spreadsheets, the gap between your reporting speed and investor expectations is widening.
Why management reporting packages matter for Indian startups
Picture this. It is 11 PM before a board meeting, and you are wrangling spreadsheets, mismatched ledgers, and unexplained burn. A strong management reporting package turns that chaos into clarity. It keeps investors aligned and helps you run the business with confidence.
Investors want proof of cash discipline, growth quality, and decision velocity. In India, they are also watching your controls around GST compliance, TDS reconciliation, and working capital management. The usual fire drills, from last-minute decks to bank-to-ledger data inconsistencies, erode credibility.
Think of your reporting package as your primary investor communication tool. It should be consistent in format, rigorous in numbers, and explicit in actions.
If you do this right, your package doubles as your operational dashboard too. It builds financial intelligence you use daily, not just board-meeting cosmetics.
What makes up a management reporting package
A founder-grade package includes a finance deck, KPI pack, cash summary, risk register, and action tracker. All in a consistent monthly format. Monthly gives depth. Mid-month flash reports give timely signal. Quarterly expands strategy and scenarios without reinventing the wheel.
- Finance deck with P&L, cash position, balance sheet highlights, and unit economics
- KPI pack with definitions and trends
- Cash summary with runway, sensitivities, and collections plan
- Risk register with mitigation owners and deadlines
- Action tracker with status and next steps
Consistency beats complexity. Templates beat recollection.
The monthly finance deck template that actually works
Executive summary
Thirty-second story. Highlights, asks, and headline numbers: revenue run rate, burn, runway, and critical ops changes.
P&L walkthrough
Actuals versus plan, margin trends, and variance drivers. If gross margin dipped 5%, say whether it was mix, pricing, or input cost inflation.
Cash flow and runway
Burn trends, runway, and sensitivity. Use your runway calculations to show scenarios. Model seasonal cash flow patterns and working capital swing.
Balance sheet highlights
Working capital, with accounts receivable (AR) and accounts payable (AP) breakdowns. Call out GST input credit positions clearly.
India-specific compliance updates
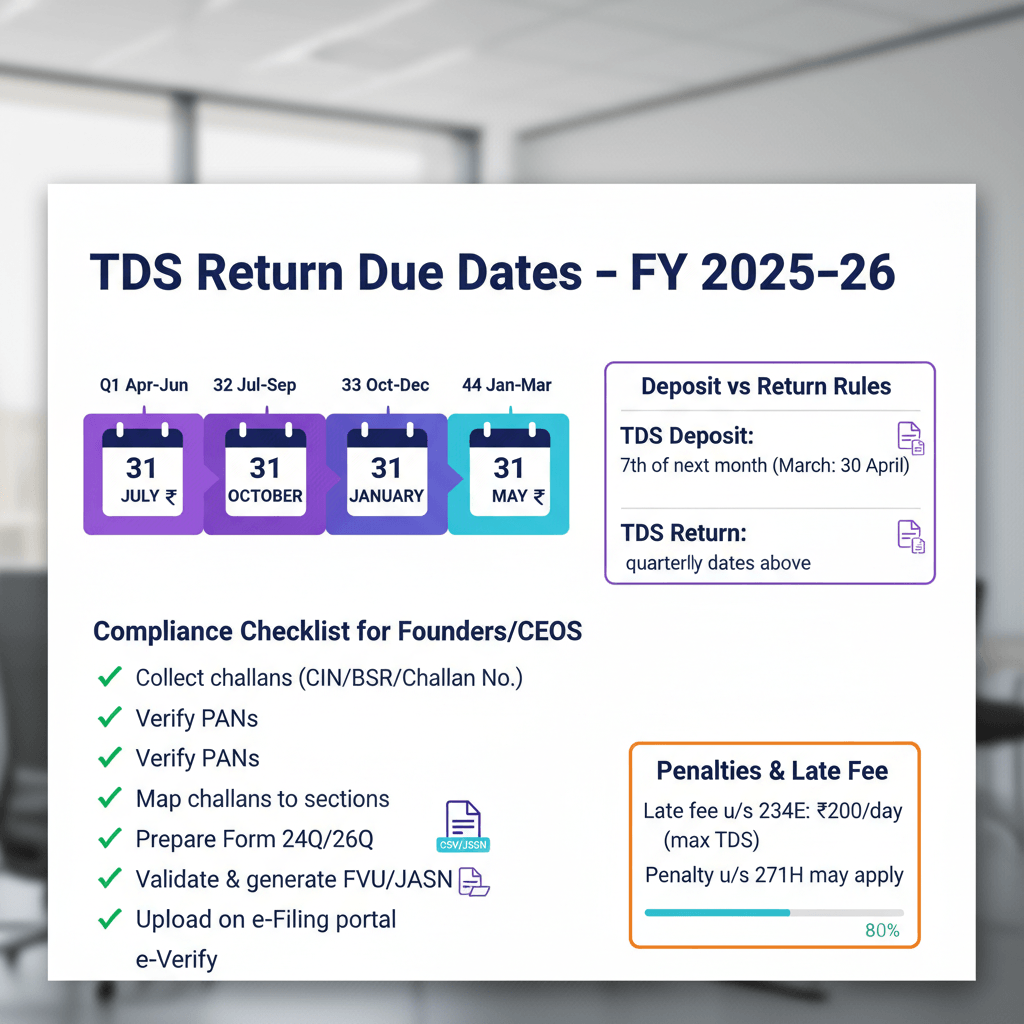
Status of GSTR-1 filing and GSTR-2B reconciliation, plus TDS hygiene. Since April 2025, startups above ₹1 crore turnover must also confirm e-invoice IRN generation as part of this section, per CBIC circulars on e-invoicing.
Unit economics and pipeline
Show how revenue engine quality translates to profit. Tie operational metrics and financial performance clearly.
Make it scannable. Use clear trend lines, traffic-light statuses, and annotations that explain what happened, why, and what you will do next.
Metrics that matter to investors in the Indian context
Growth quality
ARR and MRR growth, gross and net margin trends, NRR and GRR, CAC and payback, sales efficiency.
Discipline and liquidity
Burn multiple, operating cash flow, runway scenarios, working capital needs, DSO, DPO, and cash conversion cycle. Aim for burn multiple under 2x. Explain your path back if not.
Health and India-first indicators
Customer concentration, AR and AP aging, GST and TDS flags, FX exposure. As a rule of thumb, target DSO under 45 days for Indian B2B. SaaS gross margins should be above 70%. Monthly churn under 5% for B2B. Cash conversion cycle under 60 days.
Always connect movement to action. Do not just report that DSO rose. State which segments drove it and your collections plan.
For benchmarks on Indian SaaS metrics, the ICAI's guidance on financial reporting standards provides useful context on revenue recognition and disclosure norms that shape how investors read your numbers.
Board reporting automation: from chaos to clarity
Manual does not scale. Automation compounds. It cuts manual work, slashes errors, and frees time for analysis and narrative.
Build your automation loop
- Start with clean ingestion. Use OCR tools tuned for Indian bank statement formats. Then map transactions (sometimes called ledger entries or vendor invoices) to your chart of accounts consistently.
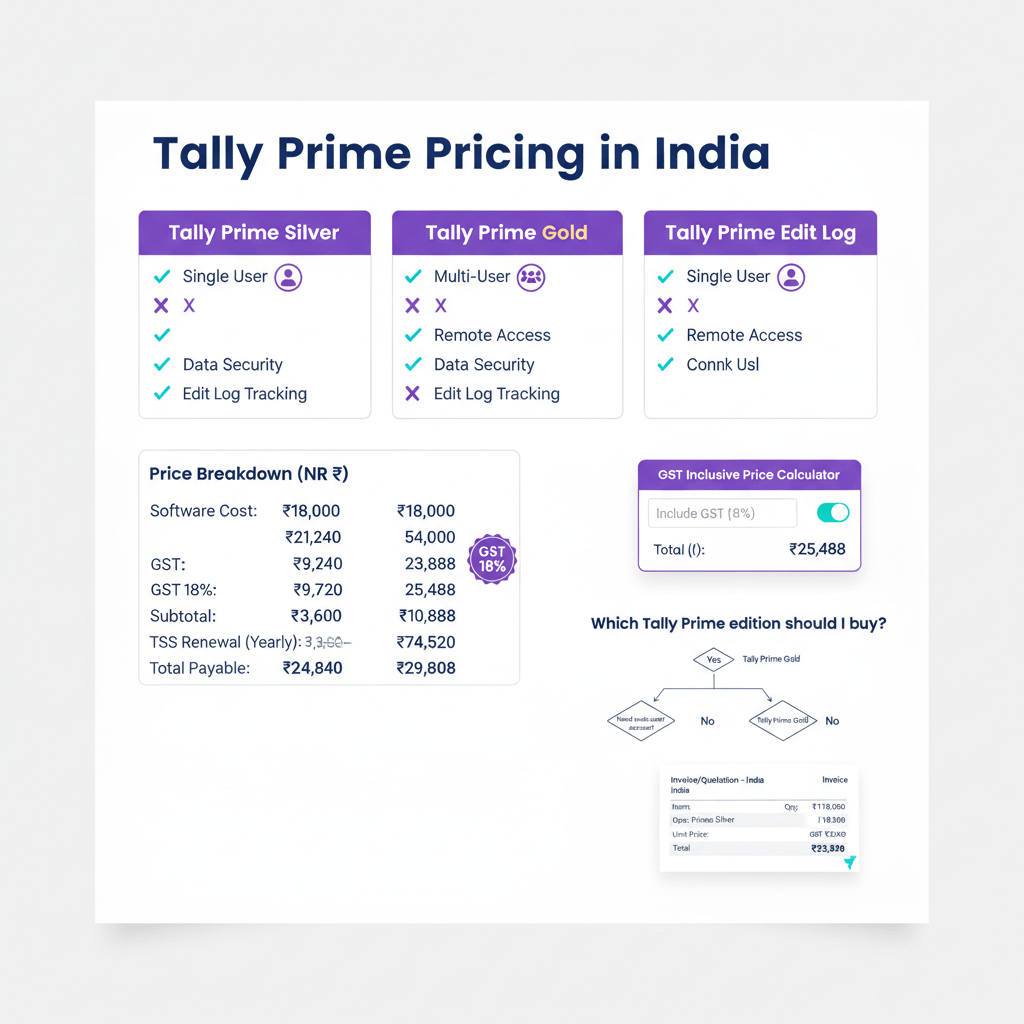
- Enable one-click sync with Tally Prime automation, so statutory books remain the source of truth while powering management dashboards.
- Use anomaly alerts. Flag duplicate bank transactions and hidden bank charges. Maintain an audit trail for every automated step.
Tools to consider
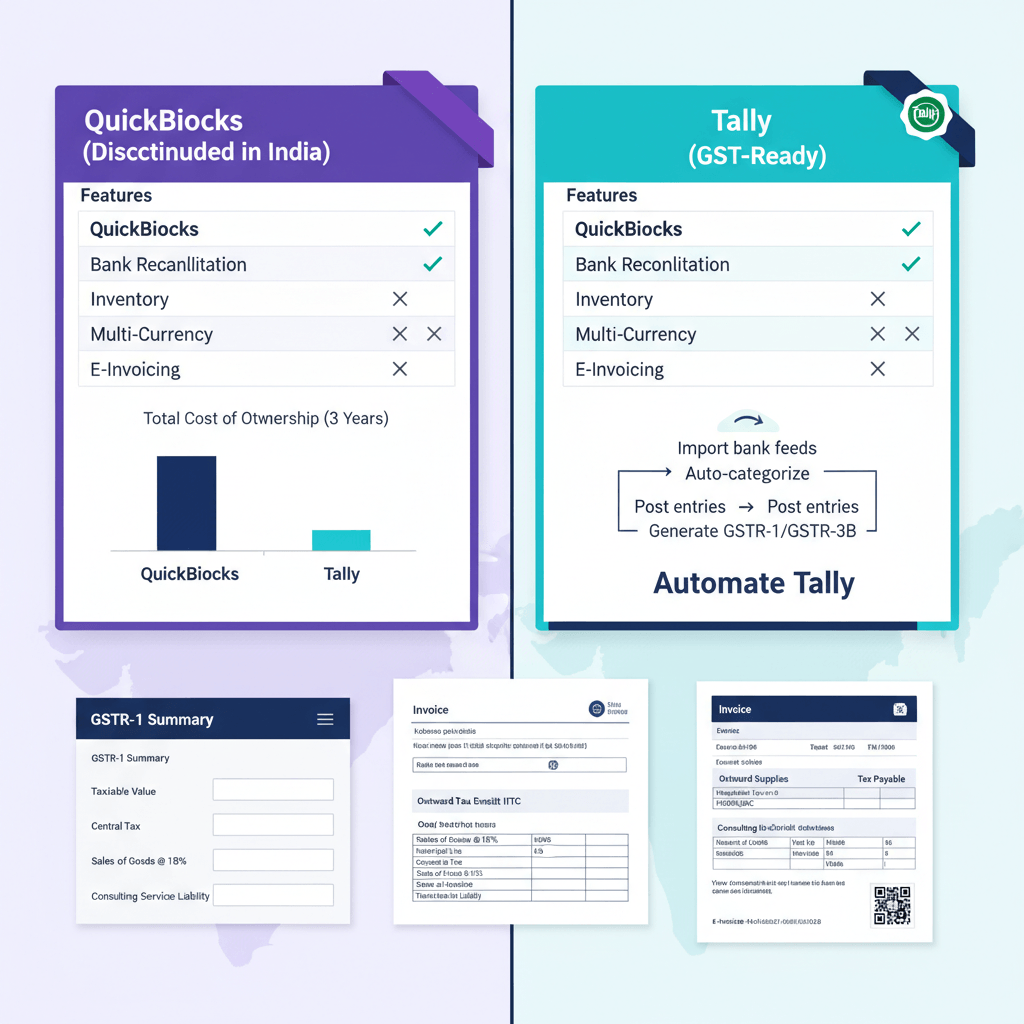
- AI Accountant for automated bookkeeping, reconciliation, and MIS reporting tailored to Indian banks and GST
- QuickBooks
- Xero
- FreshBooks
- Tally
The cadence: checklist close, auto-refresh dashboards, export to deck, annotate insights. Many CA firms report a reduction from 10-day closes to 3-day closes once this loop is in place.
Financial storytelling for non-finance teams
Your package is a bridge, not a barrier. Translate numbers to actions that marketing, sales, product, and ops can execute.
From metrics to moves
- Show channel-wise CAC and payback so marketing shifts budget where returns are strongest.
- Link discounting and deal size to margins so sales prioritises profitable segments.
- Use inventory and receivables signals to adjust procurement or collections sprints.
The narrative that sticks
Use the framework: Context, Signal, Implication, Owner, Deadline.
For example: context, DSO was 35 days. Signal, now 52. Implication, an extra 2.5 months of working capital is locked. Owner, sales ops. Deadline, new terms training deployed by month-end.
Eliminate vanity metrics. Build a KPI glossary. Give team-specific views that spotlight leading indicators rather than lagging ones.
Building your management reporting system in 7 days
Day 1 Connect banks and accounting systems. Set exports where APIs do not exist.
Day 2 Define metric formulas and data sources. Prevent inconsistencies before they start.
Day 3 Assemble the deck template with placeholders. Lock the structure.
Day 4 Craft variance narratives. Write exemplar explanations for common scenarios.
Day 5 Dry run with last month's data. Gather feedback. Fix gaps.
Day 6 Document close checklists, validation steps, and the timeline.
Day 7 Schedule automated pulls, dashboard refreshes, and alerts. Set a monthly rhythm.
This 7-day plan works whether you are a first-time founder or a CA firm onboarding a new client. The goal is a repeatable system, not a perfect deck.
Common pitfalls that derail founder reporting
- Measuring too much If it does not drive a decision or have an owner, drop it.
- Mixing booked and cash Choose one per view. Label clearly. Be consistent.
- Ignoring GST and TDS hygiene Embed GST reconciliation and TDS checks into your monthly close. With the GST portal now flagging mismatches faster, quarterly cleanups are no longer enough.
- Static decks without accountability Every metric needs an owner, target, and date.
- Overlooking seasonality Bake business rhythms into explanations and forecasts. Indian startups often see Q4 (January to March) collection spikes due to fiscal year-end payments.
- Overcomplicating Keep the core deck to 12 to 15 slides. Push deep dives to the appendix.
Downloadable templates and implementation resources
Monthly finance deck template Executive summary, P&L with variances, cash and runway, balance sheet working capital, India compliance, unit economics, and forward guidance.
Metrics dictionary Define revenue recognition, customer counts, churn, LTV, CAC, burn, runway, working capital, and compliance metrics. Include sources and edge cases. Align definitions with ICAI reporting standards where applicable.
Monthly close checklist Bank reconciliation, AR and AP review, revenue and deferrals, expense accruals, GST and TDS tie-outs, dashboard refresh, deck preparation.
Dashboard templates Compliance tracker, cash trends, AR and AP aging, runway scenarios, unit economics by segment.
Success metrics Close time, categorisation accuracy, stakeholder clarity, and decision speed.
Advanced automation strategies for scaling startups
Multi-entity consolidation Automate eliminations and inter-company entries. Provide both consolidated and standalone views. Standardise your chart of accounts across entities.
Predictive cash flow Scenario models driven by customer payment patterns, supplier terms, and inventory turnover. Layer in seasonal adjustments specific to your industry.
Automated variance analysis Teach the system seasonality. Flag exceptions. Suggest priorities with reusable explanation templates. This is sometimes called robotic process automation (RPA) for finance workflows.
Operational integrations Connect CRM, billing, inventory, HRIS, and project tools. Automate revenue recognition and unit economics by customer or project.
Audit-ready trails Maintain line-of-sight from every board number back to the source document. This is critical for diligence rounds and statutory audits under the Companies Act requirements from MCA.
Making your numbers tell a compelling story
Connect metrics to strategy. If your goal is capital efficiency, show how CAC, payback, working capital, and operating leverage are moving together.
Be candid about risks. Include mitigation owners and timelines. Provide benchmark context, or show progress versus your own targets.
When investors see consistent, thoughtful financial communication, they gain confidence in your ability to scale efficiently, manage capital responsibly, and course-correct quickly.
Start simple, then compound. Your reporting discipline becomes an advantage in execution, board management, and fundraising.
FAQ
How should a CA structure a monthly founder report so that it is board-ready in India?
Use a consistent sequence: executive summary, P&L with variances, cash and runway sensitivities, working capital and compliance highlights, unit economics, and an action tracker with owners. Keep the core deck to 12 to 15 slides, ensure a clean GST and TDS tie-out (including e-invoice IRN validation for businesses above ₹1 crore turnover), and map every KPI to a definition in your glossary.
What is the fastest way to cut month-end close from 10 days to 3 without sacrificing control?
Automate bank ingestion with OCR tuned to Indian formats, sync ledgers from Tally, run automated anomaly checks for duplicates and hidden charges, and maintain a tight close checklist with ownership. The key is shifting CA time from data wrangling to review and narrative, which is where judgment adds value.
Which metrics do investors prioritise for Indian SaaS startups?
ARR and MRR growth, NRR and GRR, gross margin above 70%, CAC and payback, burn multiple under 2x, and runway scenarios. Present trend lines, compare to plan, and explain drivers. With 2026 funding levels tighter than peak years, boards are spending more time on cash conversion cycle and collections velocity than raw top-line numbers (2026 update).
How do I reconcile management reports with GST returns to avoid credibility gaps?
Embed a monthly GST reconciliation step that ties GSTR-1 and GSTR-3B to management P&L. Track input credits from GSTR-2B, document timing differences, and ensure manual adjustments are logged with an audit trail. Since the e-invoicing threshold dropped to ₹1 crore in April 2025, startups must also verify IRN generation matches their sales register before filing (2026 update).
What burn multiple is acceptable during growth, and how do I justify a higher number to the board?
Under 2x is a healthy target. If burn multiple exceeds that, justify with a time-bound plan: front-loaded hiring, product launch, or market expansion that compresses CAC and shortens payback in the next two quarters. Provide sensitivity scenarios and show how working capital initiatives like AR collection sprints improve the cash picture.
How can a CA standardise metric definitions across finance, sales, and marketing?
Create a KPI dictionary that defines sources, formulas, exclusions, and edge cases. Publish it alongside the monthly deck and lock versions. When dashboards and decks always compute KPIs the same way, you prevent the metric drift that erodes board trust over time.
What does a 7-day implementation plan look like for a first-time founder setting up management reporting?
Day 1 connect banks and accounting systems. Day 2 define metrics. Day 3 assemble the deck template. Day 4 write variance playbooks. Day 5 dry run with real data. Day 6 document the close checklist. Day 7 schedule automations and alerts. This works whether you are on Tally, QuickBooks, or any standard accounting platform.

A results-driven finance and sales professional with hands-on experience through finance internships and a fast-paced sales role. With a strong interest in accounting and business finance, Harsh focuses on turning complex topics into clear, practical takeaways for founders and finance teams.